Introduction to section: Market
We have defined our market in Section (4). Here our task is (a) to forecast its development, (b) rank the regions according to their importance, and (c) to decide on our overall strategy.
The term "market" has different meanings in different contexts. In this section under market, market size, or market development we understand the "total market demand".
"Total market demand for a product is the total volume that would be bought by a defined consumer group in a defined geographical area in a defined time period in a defined marketing environment under a defined level and mix of industry marketing effort." (1)
Market development is one of the most important indicators about the market environment: it reveals which way the market is heading, up or down. In his famous work, "Principles of Marketing" Professor Philip Kotler analyzed the growth curve of different products and divided the product life-cycle into four phases: introduction, growth, maturity, and decline.
Each phase of the life-cycle requires a different marketing strategy. To learn which phase of market development a product is in, is the key to successful marketing planning. The entire marketing strategy will thus depend on the market forecast we make.
Market forecasting is not an easy task. There are different methods to choose from, and each has advantages and disadvantages. Therefore, we will make several forecasts, working until we find the one which fits the product best. Ultimately, our estimates and understanding of the marketplace will play a vital role in developing the final forecast.
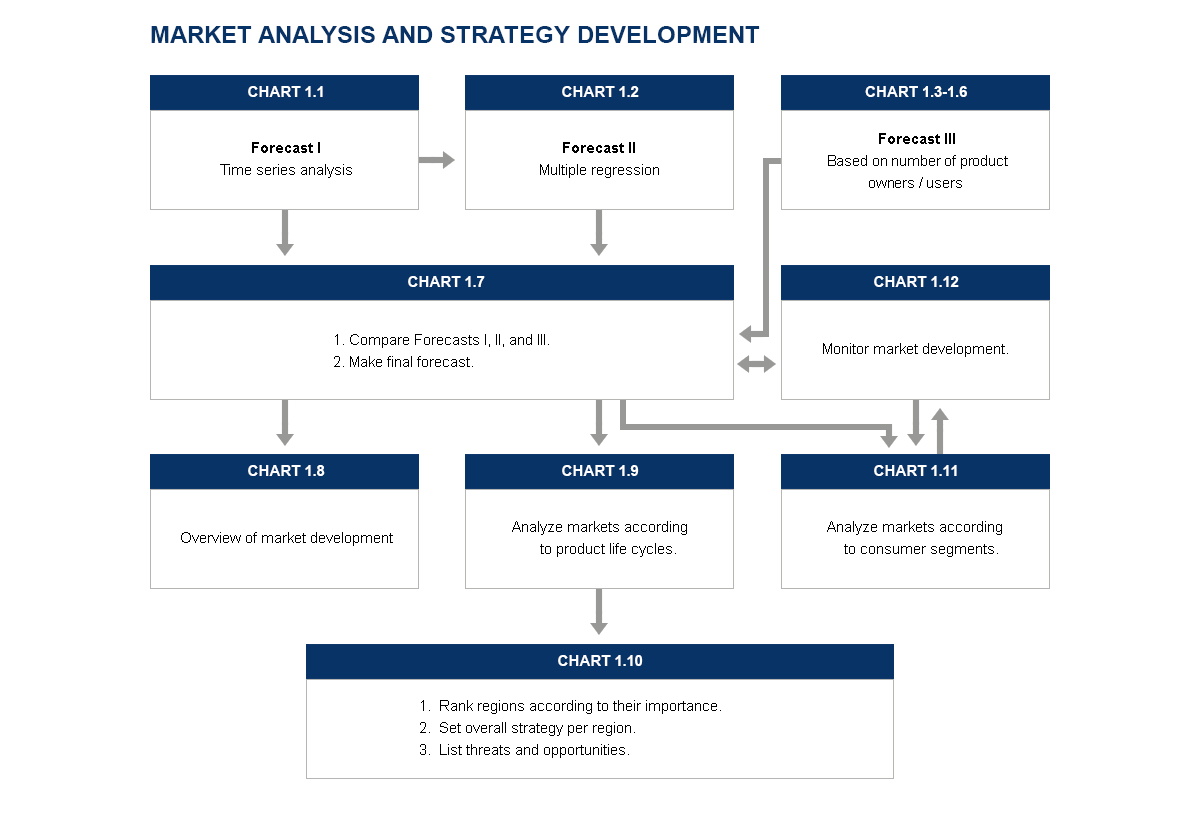
MARFIN offers three different methods for forecasting the market development. All of them are shown in Chart 1.7, so that we can compare the various forecasts and use the most realistic one, or make a final forecast based on any combination of them.
Forecast I uses the time series methods of forecasting which are based on the assumption that, for the most part, the sales trend of the past will continue into the future. They recognize, however, that there are random fluctuations around the trend and that the forecasting method should not react too quickly to them. (Chart 1.1).
Forecast II uses the multiple regression methods of forecasting which incorporate, in addition to past data, the major factors that influence the market development of our product. They are based on the assumption that historical relationships of sales with other factors will continue into the future. Hence the method looks for "leading indicators" and measurement of their effect. (Chart 1.2).
Forecast III - a method used for consumer durables - involves estimating the level at which ownership will be saturated, the rates of scrapping the product, and the proportion of the scrapped items that are replaced (Charts 1.3 - 1.6).
In case of packaged goods (or services), we will forecast the development of the number of consumers first, then their average consumption; by multiplying the two variables we will arrive at the projected market size.
Forecast IV - is the final forecast. It is based on a comparison of the above forecasts and on our own estimates.(Chart 1.7).
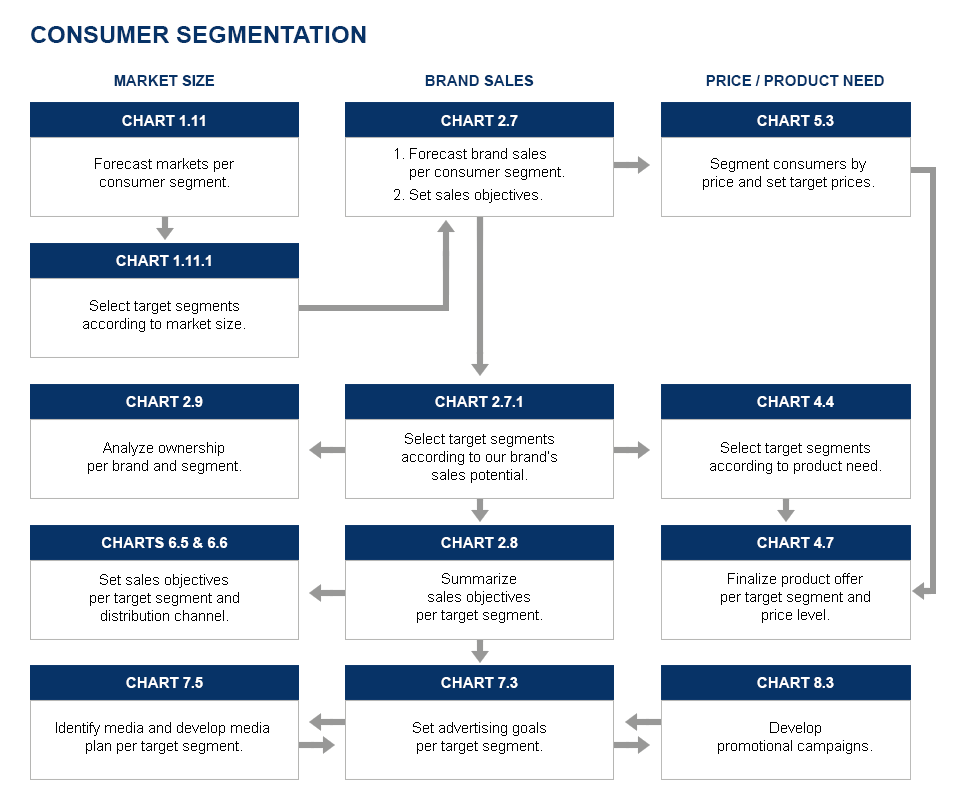
MARFIN also analyzes the market development in the various consumer segments in Chart 1.11. This information is needed for developing a consumer segmentation strategy in Section (4).
(1) Kotler, Principles of Marketing, p.200
Introduction to section: Market Share
The purpose of Section (2) is to set sales objectives for our brand. In order to do that, we need to answer the following questions:
1. How is our position vs. the competition?
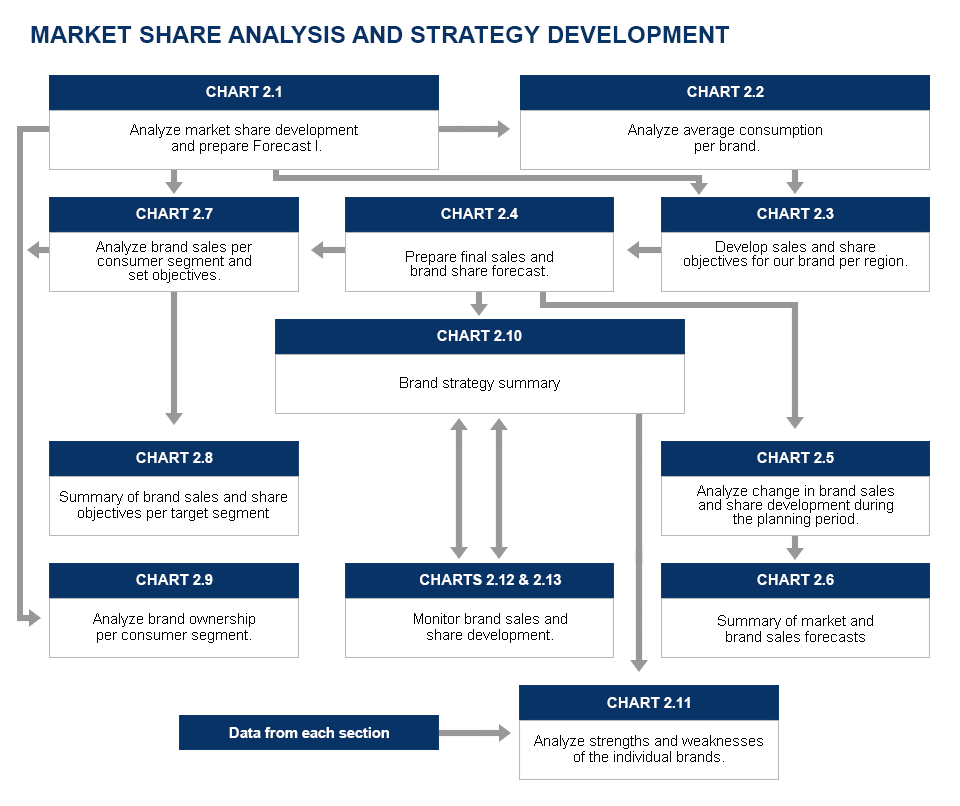
As the first step, we have to determine our market share and the trend of our market share development in Chart 2.1.
We have to know both our absolute and our relative positions. The absolute position reveals our ranking in the marketplace (Are we the market leader?); our relative position is expressed in the market share number: What share of the total market do our sales represent?
2. Which are the most important markets on which we should concentrate our marketing strategy?
Depending on our business objectives - whether we want maximum growth or maximum profits - we will identify the markets with the largest sales or profit potential for our brand. They are not always the largest markets.
Two major factors influence the growth opportunity within a market: One is the growth rate of the market itself or the phase of the product life-cycle the market is in (Chart 1.9); The second is the competitive situation in that market (Charts 2.1 and 2.3).
3. If we want to follow a market segmentation strategy, on which segments should we concentrate our marketing efforts?
Just as the targeted marketplace, the target consumer segment selection depends on the size of the segment and on the competitive situation (Chart 2.7). Our final selection will also be influenced by the attitude of the selected consumer segments to the other elements of the marketing mix. We might thus revise our selection several times as we go along with the strategy development.
Section (2) also identifies two key pieces of information for strategy development:
- 1. Identification of major brand/s the share of which we intend to take. By pinpointing the brand/s of our target and knowing its strengths and weaknesses, we will be able to develop the right strategy.
- 2. Strengths and weaknesses summary per major brand (Chart 2.11) which is based on the overall analyses developed during the planning process. It contains the major elements of each MARFIN section pertaining to brand qualification.
Introduction to section: Financial
Financial analysis is also an essential part of the marketing plan. Ultimately, it is the bottom line result that measures the success or failure of the marketing strategy. Can we meet corporate profit objectives? This is the most important question.
The reason for not meeting corporate objectives is usually one or more of the following:
- Market growth does not guarantee sufficient sales increase to meet sales objectives.
- The marketing strategy is incorrect.
- The investment in marketing necessary to realize the planned sales increase is too high to meet profit goals.
- The product's or the company's cost structure is too expensive to compete profitably in the marketplace.
Sections (1) and (2) addressed the market growth potential question and Sections (5) to have (8) the marketing strategy. This section will deal with the other two points, the necessary marketing expense and the company's cost structure.
The level of marketing investment for establishing a brand in a new market is often so high that it functions as a barrier to entry. Nevertheless, if we failed the first time, we may try again and develop new sales objectives with a new marketing strategy. But, please be aware of the most common pitfall - a change in marketing expense should always result in new sales figures!
For example, it is not possible to cut advertising spending and realize the same sales volume. If this were possible, then why in the first place would we have planned to spend more money than necessary? New sales figures mean new marketing strategy, and new marketing strategy means new levels of marketing expense.
If, on the other hand, the cost structure is responsible for the negative results, then we need to find out whether it is the product cost structure (C.O.G and marketing expense) or the corporate cost structure (indirect expenses and allocations) which is out of line and needs to be remedied.
The second financial task of a marketer is profitability control. Throughout the planning year, the planner must keep an eye on the marketing expense-to-sales ratio and monitor its development per product, market, distribution channel, and consumer segment. A company should not overspend to achieve its sales goals.
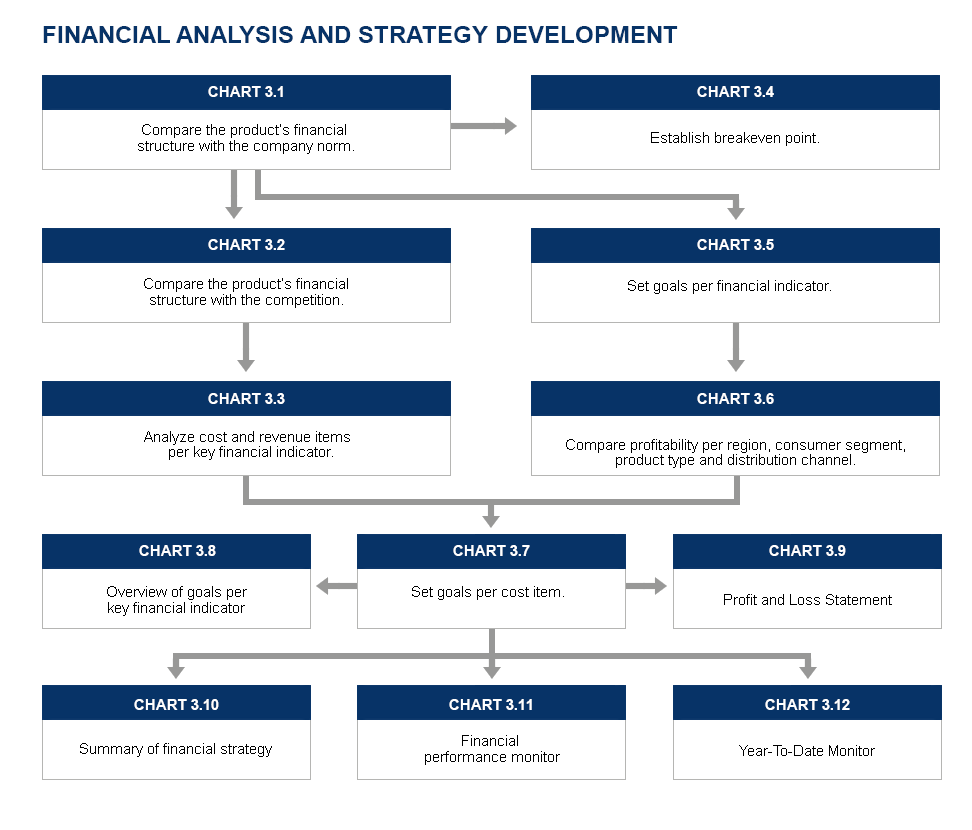
MARFIN approaches the financial analysis only from a marketing point of view. Its purpose is to analyze our cost structure and monitor its development; identify cost items which perform worse than the norm and develop targets for them. Strategies for attaining those targets will be developed by product management together with the financial department.
MARFIN does not seek to replace the task of the financial department but to cooperate with them by providing guidelines for budgeting.
Introduction to section: Product
The objective of this section is to develop a product strategy which will appeal to a large enough consumer group to realize our sales and profit targets. Developing a product strategy means selecting an unsatisfied consumer need and have a product developed to fulfill such need.
A product can be anything that satisfies a consumer need and offered for sale or exchange. We can design the right product strategy only when we understand how our product fits into its environment, which is made up of the market, the consumer, and the competition.
Market positioning with consumer segmentation are the major tools used for product strategy development. The market positioning process aims at identifying insufficiently fulfilled consumer needs; product attributes or features with respect to a particular consumer group. The product needs to offer a clear and distinctive advantage to the target customers.
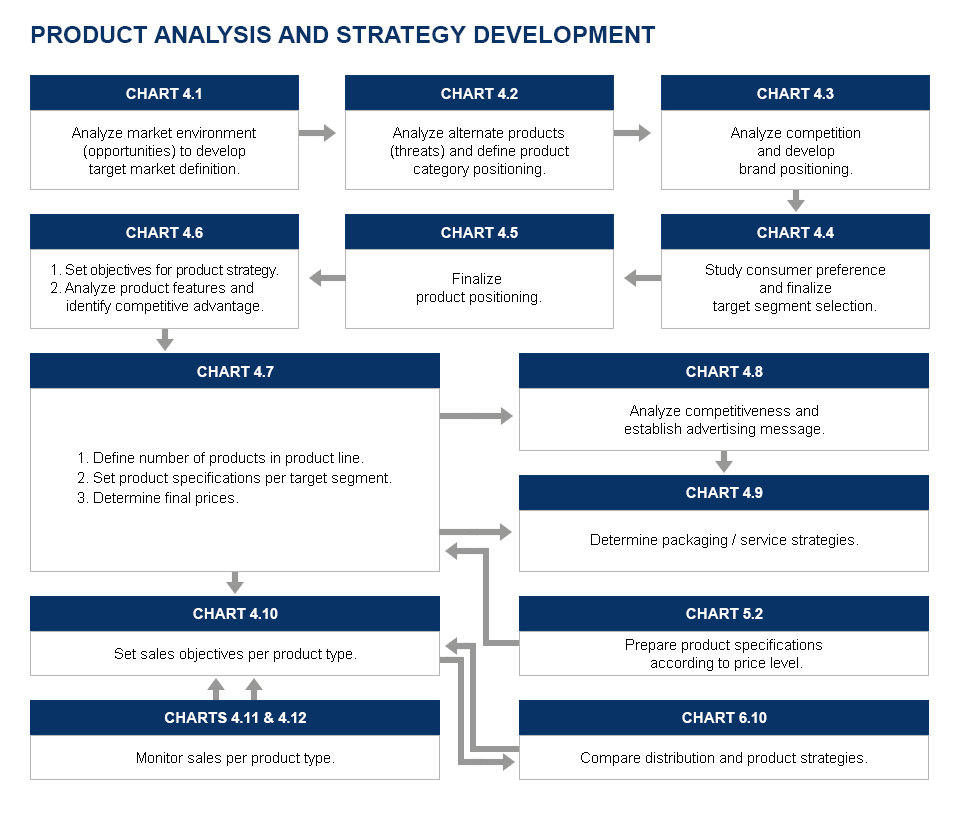
How we define our target market and position our product within will be the key to our success. MARFIN uses a four step procedure:
- Step 1. We study the market environment and define our target market, i.e., we identify the consumer need/s our product should satisfy. (Chart 4.1)
- Step 2. We position our product category within the target market against alternate products; (Chart 4.2)
- Step 3. We position our brand within the product category against competing brands. (Chart 4.3)
- Step 4.We identify the target consumer segments: those consumers to whom the selected needs or product attributes/features are relatively more important. (Chart 4.4)
The purpose of market positioning and consumer segmentation is to identify consumer groups with different attitude to the product. Bringing products to the market which satisfies their unique needs better, can give us the much sought after competitive advantage. The most popular criteria for segmenting are demographics, life style, and amount of product use, geography and price sensitivity. We can select one or several target groups. We just have to make sure that their sizes are large enough to meet our sales objectives.
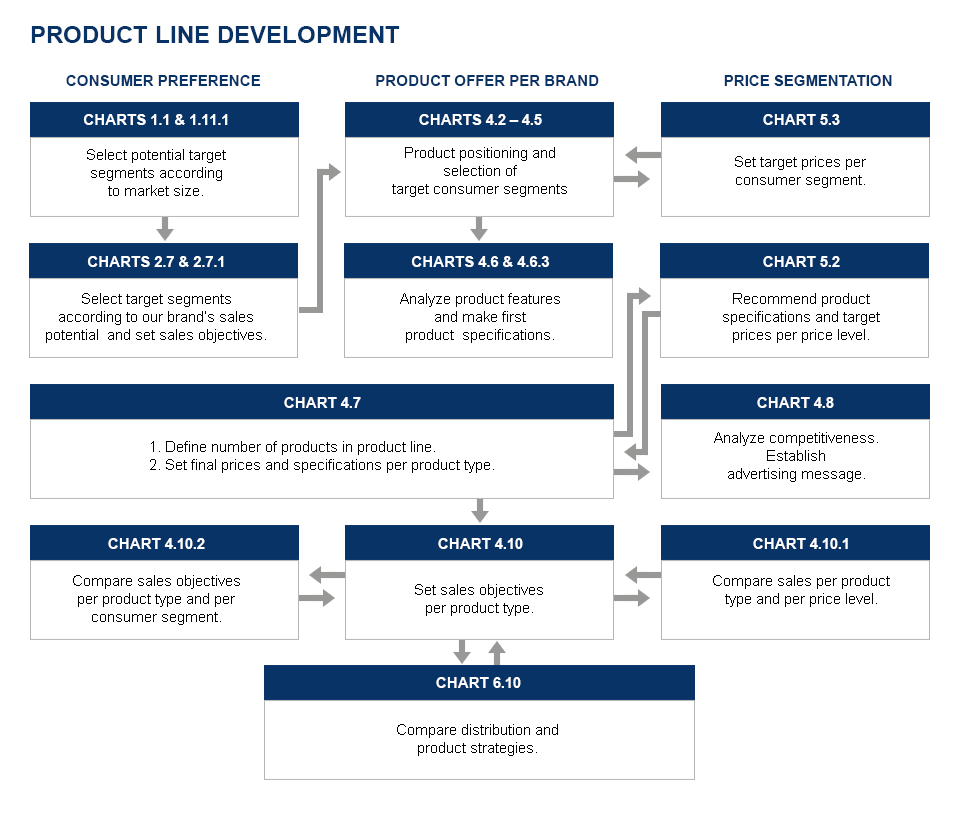
Market segmentation results in Product Differentiation, i.e. in selling products which differ in package, style, size, or features to different consumer groups. The number of products in our product line will depend on the number of consumer segments we want to serve.
Once the product strategy is developed, the planner summarizes and compares it to the competition in Chart (4.8); and develops the required packaging/service strategies in Chart (4.9).
The last step in our product strategy development is to forecast sales per product type. The total sales per product type must equal our total sales targets set in Section (2). Our sales and market share objectives together with our price strategy will determine whether we will aim at being superior or equal to competition.
Our overall strategy - sales and share objectives - will influence our market positioning. On the other hand, market positioning is the basis of our marketing strategy and it will therefore determine all the other elements of the marketing mix.
Introduction to section:Price
Developing a price strategy means to establish our consumer prices - prices at which goods will be sold to the end consumer. Not wholesale prices or manufacturers' prices.
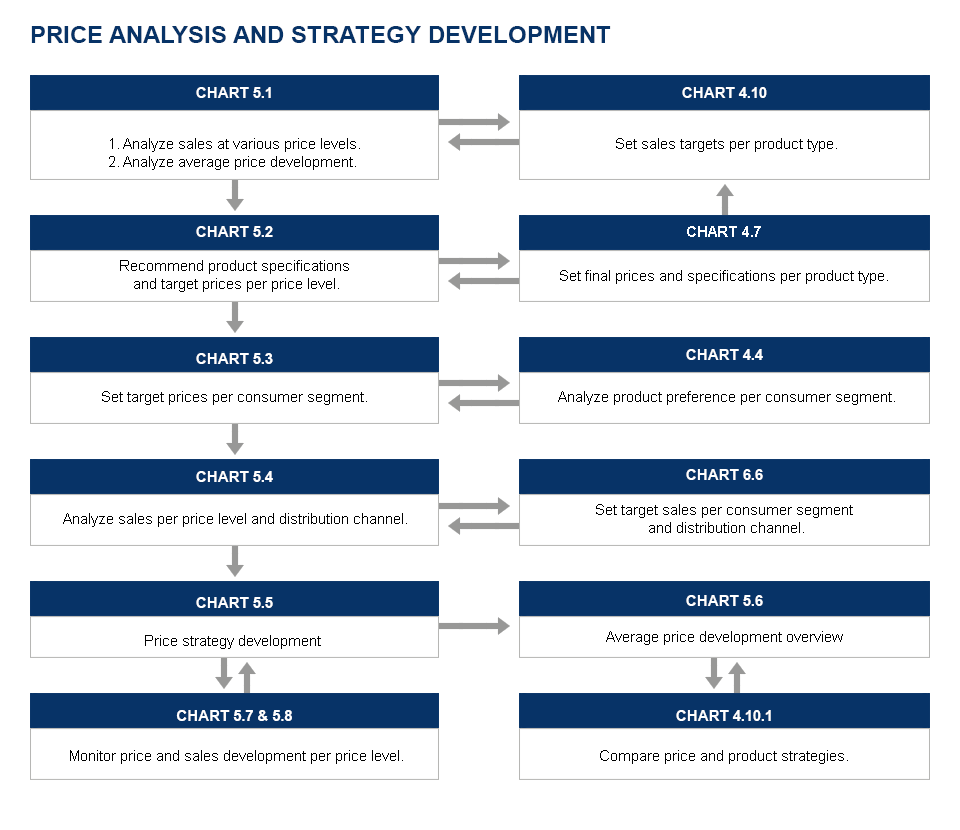
The objective of Section (5) is (a) to recommend target prices for our products by analyzing the products available in the marketplace and (b) set sales objectives per price level. There are several variables which will influence our price. We will analyze:
- The current prices on the market (Chart 5.1).
- The product features and quality of the product (Chart 5.2) per price level.
- The price acceptance of our target consumers (Chart 5.3).
- The fourth aspect of our analysis includes the distribution channels (Chart 5.4).
Each distribution channel serves a special clientele which, usually, has a different price preference. In order to develop a consistent product and sales strategy, we have to know the price patterns in the various distribution channels and plan our sales accordingly. First we develop our price strategy and then select the distribution channel to match it. But both strategies are a function of our target segment and sales objectives.
Price is not an absolute criterion but a function of the product. We must always consider the price/value relationship, i.e. which product we want to sell at what price where value means two different things: (a) quality of the product and, (b) product features. In markets with high price sensitivity, it is the price that determines the features of the product. And in markets with low price sensitivity, the product features are more important, and they determine thus the price.
Price sensitivity analysis is a key indicator for price setting. Price sensitivity or elasticity reveals the correlation between price and demand. Generally, price and demand are inversely related, that is, the higher the price the lower the demand.
In the Price Section we only set target prices which will be compared in Section (4) where the final price per product is determined. Our price strategy will be summarized in Chart 5.5 after having harmonized it with the product strategy.
In a competitive environment it is the market that decides at which prices products can be sold. Prices should reflect the perceived value of the product to the target consumers. Years ago, however, manufacturers calculated their prices by adding up their costs plus a profit percentage and hoped their products would sell. This was a very risky way to do business because it makes us vulnerable to competitive attacks.
Today's procedure is much safer. First, we analyze the market and establish the price levels at which our products should be sold to be competitive. Then, we add up our costs, and the difference between the two will be the profit margin. If the margin is not large enough to meet corporate profit objectives, it is better not enter the market, or in the case of established products, it could be wise either to reconsider corporate objectives or to exit from the market.
Thus profit is not a percentage added to costs anymore. It is the difference between the maximum price the market would bear and our costs. If we are too expensive, the margin will be small or disappear all together. There are industries where the marketing expenses are so substantial that they eat up the profit margin at low sales levels, prohibiting thus the entrance of new-comers, unless they are prepared to take losses for a certain period of time. Michael Porter called this "the barrier to entry" in his book, "Competitive Analysis".
Introduction to section: Distribution
Distribution analysis is very similar to market analysis. In the latter, we wanted to know which the major markets were and what our market share was. Here we need to know who the major distributors are and what our share per distribution channel is.
The 20:80 rule applies to distribution in general. This means that 20% of the outlets do 80% of the business. The key to success is to be present in the 20% and have a high distribution share in them. The planner’s task is thus to identify those channels where we can realize the highest sales volume at the least expense. Consequently, we must develop a distribution strategy which is sound from marketing as well as from a financial point of view.
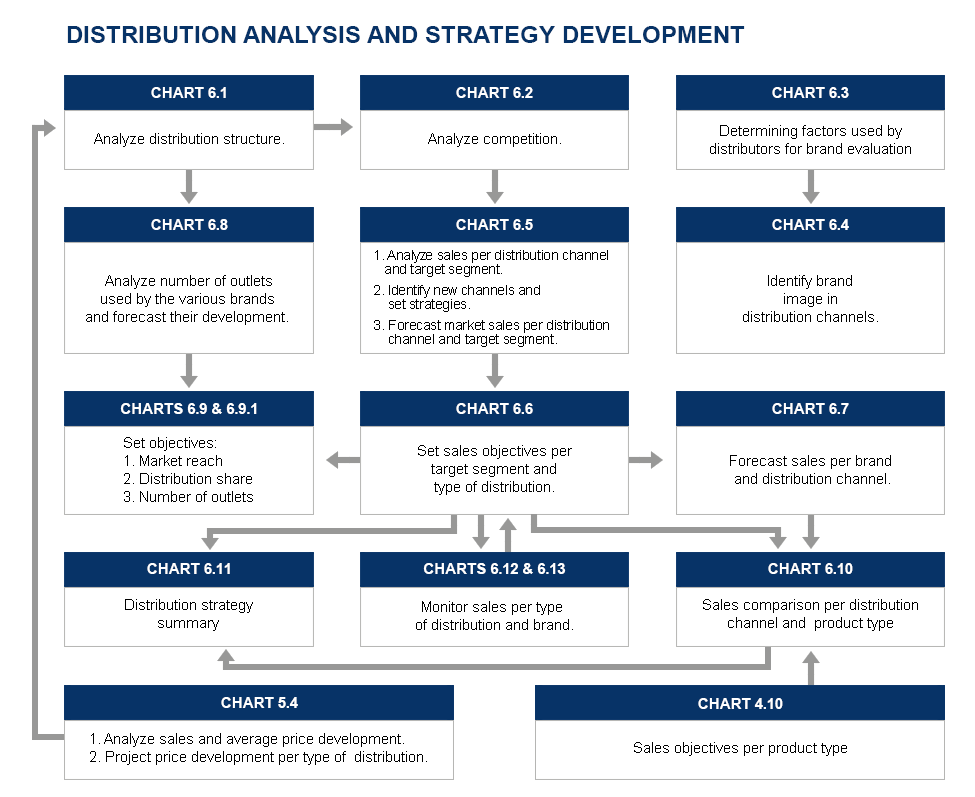
It is not enough, however, to identify the right distribution channels - we need to develop a strategy for approaching them successfully. It is tough to build an effective distribution network, especially for a newcomer. Therefore, we must study both (a) the major factors influencing the decision of a distributor to stock a brand ( Chart 6.3), and (b) the distribution policy of the competition (Chart 6.4).
One way to attain competitive advantage is to develop new channels of distribution for existing products, or lock in some distributors by, for example, offering private labels. Analyzing consumers' attitude toward purchasing our products might help identify new types of distribution. Often it is the effectiveness of the distribution network that decides the success or failure of a product. Amazon.com and generally the selling through the Internet are perfect examples of how a new distribution channel can completely revolutionize the way certain products are sold.
Distribution strategy development starts with analyzing the types of distribution channels, forecasting their sale development (Chart 6.5), and then setting sales objectives per channel (Chart 6.6). Once sales objectives are set, the planner needs to break them down to market reach and distribution share objectives (Chart 6.9). These objectives will help implement the plan. They will show how many outlets we need in order to realize our sales objectives (Chart 6.9.1), what type of outlets they should be and finally how many we need to sell in each outlet. During the year, the planner will constantly monitor the sales and share developments in each channel. (Chart 6.12 and 6.13).
Distribution strategies interlock with other marketing strategies. The selection of distribution channels should reinforce our product strategy, price decisions and promotion strategy. Sales objectives per distribution channel depend on our overall sales targets, and on our consumer segmentation and price strategies. Objectives developed in Charts (4.10) and (5.4) will have to be thus considered for our final sales projections per distribution channel Chart (6.10).
The timing of our advertising campaign should be harmonized with building up our distribution network. If we start advertising before we have an acceptable level of distribution, we waste our money. Our advertising will bring consumers into the store, but they will leave with a competing product if ours is not available.Introduction to section: Advertising
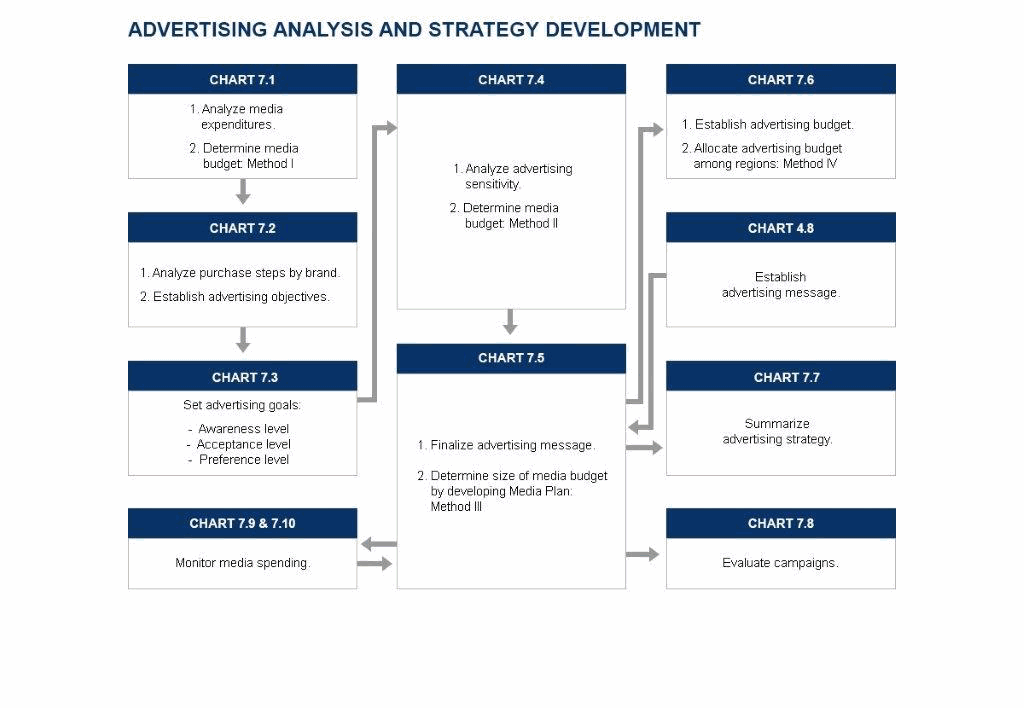
Advertising strategy consists of (1) determining objective, (2) developing the advertising message, (3) selecting the media mix, and (4) establishing the budget.
The objective of our advertising will be to convey a message to our target audience. With our message we want to increase product awareness, acceptance, preference or purchase levels. The advertising message should thus express our marketing goal. It is usually based on our product positioning and the identified competitive advantage.
The effectiveness of the advertising message depends (a) on the message itself - is it the right message for meeting a particular consumer need? and (b) on the advertising creativity, i.e. how successful we are in communicating our message.
We select the media which can convey our message in the most effective way and reaches our target audience in the most efficient way. The Media Mix is the combination of media that we decided to use in our advertising campaign.
To determine the right amount of advertising for meeting our sales goals is not easy. We do not want to spend more than necessary because it means giving away parts of our profit. Neither do we want to spend too little because then our efforts and funds can be considered wasted.
If we lack funds, it is better to save our money for a sufficient campaign than to have two small campaigns which will not have the impact required. An inefficient campaign could bring us into a difficult financial situation, and it might give the impression to management that advertising will not sell our product. The internet is a relatively inexpensive way to reach a wide audience worldwide.
The key element in our advertising budget is the media expenditure. MARFIN uses three different approaches for the determination of the size of media budget:
- Method I: Where we analyze the media expenditures of the various brands and set share of voice targets for each media type based on our market share objectives (Chart 7.1).
- Method II: where we use multiple regression analysis to project the necessary media expenditures based on a correlation between sales, past media expenditures and other influencing factors (Chart 7.4).
- Method III: Where we set advertising objectives for awareness,;acceptance, preference and purchase levels per consumer segment, design the corresponding media mix and calculate the required media expenditure with the aid of marketing research data (Chart 7.5) (Objective-and-task Method)
The above methods are supplementary, not exclusive. We should use a combination of them because each enlightens the problem from a different point of view and offers a valuable check to see how close our budget is to the "ideal".
In practice budgets for existing brands are usually determined by several factors: how much we have been spending historically, how much we think our competitors will be spending and how much profit we expect to make. In planning new product introductions, we will find Method III most useful to estimate media expenses.
It is the advertising agency which implements our strategy. The effectiveness of our communication will be measured ultimately by sales. A special kind of marketing research called advertising research can help us predict whether our campaign will be successful before it is run and it can also help us analyze how it is working after the campaign has started.
Introduction to section: Promotion
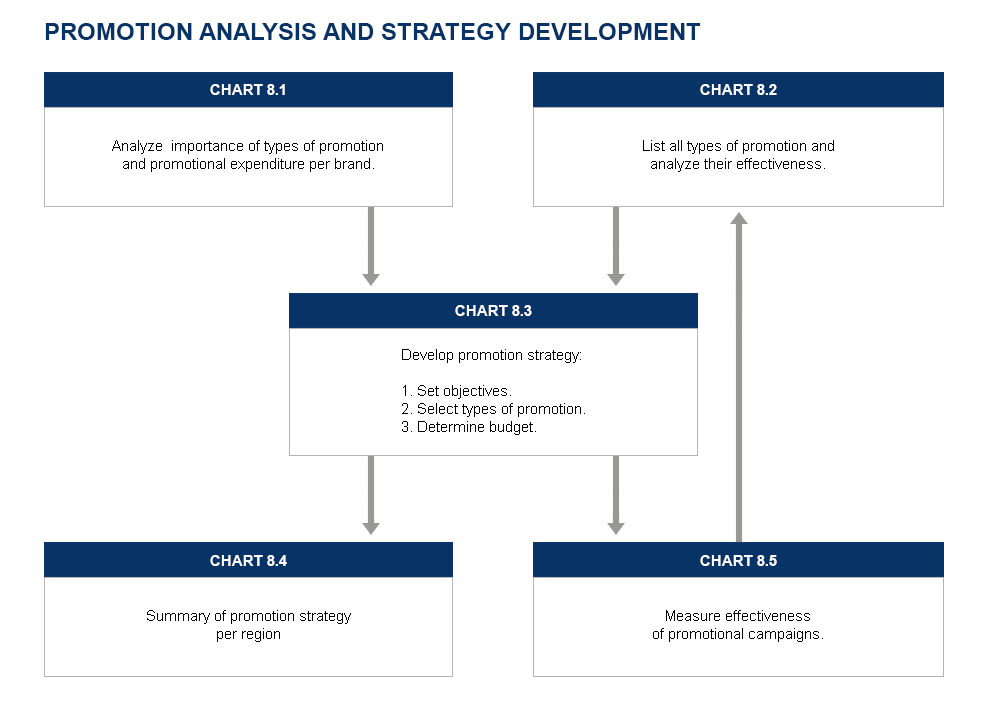
The sales promotion analysis and strategy development is very similar to that of advertising except that it is much simpler.
The real question is whether we should advertise or do promotion, or, to put it in another way, what part of our advertising funds should be appropriated for sales promotion. Our decision will depend: on the product, on the market situation, on the life cycle the product is in.
The objective of the campaign automatically determines the variables of the promotional strategy:
- Target: consumer, trade, sales force
- Type of promotion
- Budget: we must spend enough to realize the objectives
- Timing: harmonization with other strategic actions
Our ultimate objective is always to sell more goods. But the direct objectives of a promotional campaign can be different. Its task may be to solve a marketing problem like, for example, to remove impediments that prevent consumers from buying our product, or to improve our distribution network.
In short, our promotional campaign can and should support the other three elements of the marketing mix: product, price, and distribution. Promotion and advertising can also support each other. For example, we can place a coupon in the advertisement, or we can advertise the promotional campaign itself. If there is a weak spot in the marketing strategy, promotion will come to its aid. Again, the internet will pay a vital role in our strategy.
Information needed for section: Market
MARFIN is primarily a marketing database. It is superior to other databases because it stores the data in their marketing context revealing their strategic meaning immediately. An additional advantage of storing data in its marketing context is that the planner knows immediately whether information on a certain subject is available or not and how recent the data is. MARFIN also tells us about the quality of the data by a keystroke since it also stores the source of data and the assumptions used for forecasts.
MARFIN always uses sales numbers at retail prices at the consumer level. The only exception is the Financial Section where manufacturers’ sales are used at their own price level.
Forecasts are based on past development. For a reliable forecast, we need at least twenty observations. The planner will thus need the information below per geographic unit for 5 to 20 years. If our data is limited, we can improve the quality of the forecast by using quarterly or monthly sales. The more past data we have, the more accurate the forecast will be.
Market
- Market size (Market size equals sales to consumers at consumer prices.)
- Factors influencing market development
- Data on the development of influencing factors (For definition see Description, Chart 1.2)
- Size of consumer base and its development (For definition see Description Chart 4.1)
- Number of product owners (in case of consumer durables), or product (service) users
- Saturation degree development, i.e., the percentage of product owners/users in the consumer base who own/use at least one unit.
- Average consumption (in case of packaged goods and services) (Data per consumer segment can be entered only after Chart 1.11 was filled in.)
For consumer durables:
- Total number of products owned, or product penetration development,
- i.e. the percentage of the total number of products owned in the consumer base.
- Average number of products owned
- Percentage of scrapped units replaced
- Average life of the product
- Scrap percentages distribution during product life
- Additional purchases development
For consumer segments:
- Identification of consumer segmentation options, and sub-segments
- Size of consumer segments
- Market size per consumer segment
For the selected monitoring time period:
- Actual total market sales during the current year
- Actual total market sales per consumer segment
Information needed for section: Market Share
MARFIN always uses sales numbers at retail prices at the consumer level. The only exception is the Financial Section where manufacturers’ sales are used at their own price level.
Forecasts are based on past development. For a reliable forecast, we need at least twenty observations. The planner will thus need the information listed below per geographic unit for 5 to 20 years. If our data is limited, we can improve the quality of the forecast by using quarterly or monthly sales. The more the past data we have, the more accurate the forecast will be.
Market Share
- Identification of major brands
- Sales per brand and consumer segment
- Number of product users per brand and consumer segment
- Average consumption per brand and consumer segment
- Brand ownership per consumer segment
For the selected time period:
- Actual brand sales during the current year per consumer segment
Information needed for section: Financial
The following data is needed for our product and per "Unit". The "Unit" is the basis of our comparison. It can be defined either as another product, another region or division within the company; or we can use the company norm. Key financial indicators may vary with each company and they should be adjusted accordingly.
Key financial indicators:
- Net Sales
- Cost of goods
- Revenue adjustments
- Marketing expense
- Selling expense
- Other direct expenses
- Indirect expense
- Company allocations
Cost items per key financial indicator per “Unit”:
- Advertising
- Promotion
- Sales Force
- Market Research
- Administration
Other financial indicators:
- Hurdle rate or company profit target
The following information is needed per major brand as defined in Chart 2.1:
- Net Sales
- Cost of goods
- Revenue adjustments
- Marketing expense
- Selling expense
- Other direct expenses
- Indirect expense
- Company allocations
Product information for breakeven analysis:
- Target retail price per unit
- Variable costs per unit
- Quantity increment
- Proposed sales increase and discount rate per version
- For the product that is used for comparison, enter the data as required by Chart 3.4.
For monitoring:
- Actual data for the selected time period per product type and distribution channel
Information needed for section: Product
MARFIN always uses sales numbers at retail prices at the consumer level. The only exception is the Financial Section where manufacturers’ sales are used at their own price level.
Forecasts are based on past development. For a reliable forecast, we need at least twenty observations. The planner will thus need the information below per geographic unit for 5 to 20 years. If our data is limited, we can improve the quality of the forecast by using quarterly or monthly sales. The more the past data we have, the more accurate the forecast will be.
Product
- Definition of the market environment in which the company wants to operate
- List of markets belonging to the defined market
- Consumer base definition and its total size (see Chart 4.1)
- Number of consumers per market
- Size of the market environment and of each market
- Market/Consumer indicator
- Product attributes belonging to the target market(s) (Chart 4.2)
- List of alternate product categories
- Rating of the product categories per consumer need, product attribute and per target segment
- Number of current consumers per product category
- Market size per alternate product category
- Brand evaluation per product attribute and consumer segment
- Number of potential consumers
- Rating of consumer preference per product attribute
- Identification of product features (Chart 4.6)
- Rating of each brand on each product feature
- Number of products carried in the product lines of the various brands
- Ranking and rating of importance of product features per target segment
- Brand sales per product type
- Forecast of brand sales per product type
Description of competitive product offers per major brands:
- Product name
- Target segment
- Product positioning
- Product feature/s
- Reason (product feature explanation)
- Advertising message
For the selected time period:
- Actual market development per product type
- Actual brand sales development per product type
Information needed for section: Price
MARFIN always uses sales numbers at retail prices at the consumer level. The only exception is the Financial Section where manufacturers’ sales are used at their own price level.
Forecasts are based on past development. For a reliable forecast, we need at least twenty observations. The planner will thus need the information below per geographic unit for 5 to 20 years. If our data is limited, we can improve the quality of the forecast by using quarterly or monthly sales. The more past data we have, the more accurate the forecast will be.
Price
- Definition of price levels (Chart 5.1)
- Sales per price level per brand
- Average price per price level per brand, or sales in currency per brand
- Sales forecast per price level
- Product features per brand per price level
- Sales per consumer segment per price level per brand
- Average price per target segment per price level per brand,
- or sales in currency per target segment and brand
- Target prices per target segment
- Sales per distribution channel per price level per brand and target segment
- Average price per distribution channel per price level per brand and target segment
For the selected time period:
- Actual brand sales per price level
- Actual market sales per price level
- Actual sales of other brands per price level
Information needed for section: Distribution
MARFIN always uses retail prices at the consumer level. The only exception is the Financial Section where manufacturers’ sales are used at their own price level.
Forecasts are based on past development. For a reliable forecast, we need at least twenty observations. The planner will thus need the information below per geographic unit for 5 to 20 years. If our data is limited, we can improve the quality of the forecast by using quarterly or monthly sales. The more the past data we have, the more accurate the forecast will be.
Distribution
- Identification of types of distribution channels where our types of products are sold
- Number of outlets per type of distribution
- Total sales per type of distribution
- Number of outlets of "our distributors" (Distributor types who sell our product)
- Total sales of "our distributors"
- Our brand sales per type of distribution
- Sales of major brands per type of distribution (As defined in Chart 2.1)
- Major determining factors used by distributors when they decide to stock a brand
- Ranking of determining factors according to their importance per type of distribution< /li>
- Evaluation of major brands per determining factor per type of distribution< /li>
- Identification of potential new distribution channels
- Market sales and forecast per type of distribution and target segment
- Sales forecast of major brand per target segment and type of distribution
- Number of outlets used by the various brands per type of distribution
For the selected time period:
Information needed for section: Advertising
MARFIN always uses sales numbers at retail prices at the consumer level. The only exception is the Financial Section where manufacturers’ sales are used at their own price level.
Forecasts are based on past development. For a reliable forecast, we need at least twenty observations. The planner will thus need the information below per geographic unit for 5 to 20 years. If our data is limited, we can improve the quality of the forecast by using quarterly or monthly sales. The more the past data we have, the more accurate the forecast will be.
Advertising
- List of media currently used for advertising the product category
- The amount spent by the various brands in each medium.
- Definition of awareness, acceptance and preference levels (Chart 7.2)
- Awareness, acceptance, preference and purchase levels’ developments for all major brands
- Awareness, acceptance and preference level goals
- Identification of factors influencing the level of necessary media spending for meeting our sales objectives
- Development of influencing factors (others than defined by MARFIN)
Data needed per campaign:
- Medium and vehicle selection
- Timing of Campaign
- Target audience - Consumer base or one of the segments selected in Chart 2.7.1.
Advertising Goals (Chart 7.5):
- "Media/Advertising Reach" or GRP (Gross Rating Points)
- "Number of contacts"
- Media index
- Placement costs, i.e. cost of one insertion in the medium.
- "Awareness level" goal – taking into account duplications in the media plan. (Planner's estimate often set as target.
- "Purchase level" among those who are already aware of the product. Planner's estimate based on research data and the media plan. Often set as target.
- Average purchase during the planning year
- Duplication % within the media plan.
Advertising expenses – Campaign evaluation
- Other advertising expenses -- (production and agency fee)
- Advertising budget per geographic unit - if no media plan was developed by any other method.
- Actual total spending per brand per medium
- Actual sales results of the campaigns
- Actual awareness, acceptance, preference and purchase levels after the campaign(s)
Information needed for section: Promotion
MARFIN always uses sales numbers at retail prices at the consumer level. The only exception is the Financial Section where manufacturers’ sales are used at their own price level.
Forecasts are based on past development. For a reliable forecast, we need at least twenty observations. The planner will thus need the information below per geographic unit for 5 to 20 years. If our data is limited, we can improve the quality of the forecast by using quarterly or monthly sales. The more the past data we have, the more accurate the forecast will be.
Promotion
- Definition of types of promotion
- Amount spent by the various brands for each type of promotion
- List of all types of promotion
- Description of each type of promotion
- Effectiveness Ratio (% of campaign size resulting in sales)
- Cost Efficiency Ratio "Amount Spent per Number of Units Sold” ratio
Data needed per promotional campaign:
- Campaign objectives
- Types of promotion to be used
- Target of the campaign
- Size of the campaign
- Budget per campaign
- Timing of each campaign
- Rationale for the campaign
- Sales target per campaign
- Result of the campaign
Campaign evaluation:
- Sales results per campaign
- Effectiveness Ratio
STRATEGY OPTIONS: MARKET DEVELOPMENT
This chart is an overview of the possible strategies that the planner may follow in the different stages of the product lifecycle. These options need to be consulted again when we develop our strategy in each section to ascertain a consistent strategy without contradictions.
Introduction |
Market |
Strategy |
|---|---|---|
| PRODUCT | New product, low consumer acceptance, slow sales, no profits, few competitors |
Capitalize on first experiences: improve product acceptance and production efficiency. |
| PRICE | High/low |
Lack of competitors allows for higher prices; but a low price guarantees higher level of consumer trial. |
| ADVERTISING | Heavy advertising and |
Broad market coverage; emphasis on publicity and promotion |
| PROMOTION | Mainly personal selling to trade and consumers |
Design campaigns that: |
| DISTRIBUTION | Limited |
Be present in the major |
Growth |
Market |
Strategy |
|---|---|---|
| PRODUCT | Introduction of a product |
Introduction of special |
| PRICE | Decreasing prices due to increased competition |
Price segmentation |
| ADVERTISING | Increased competitive advertising; higher level |
Continue heavy spending; |
| PROMOTION | Less important than |
Aim at consumer trial; |
| DISTRIBUTION | Still limited |
Introduce new channels. |
Maturity |
Market |
Strategy |
|---|---|---|
| PRODUCT | Slowing growth rate; declining profits; increased competition |
Mature products - product innovations could inject new blood into the market; |
| PRICE | Price cutting |
Price segmentation |
| ADVERTISING | Extensive competitive activities |
Selective advertising |
| PROMOTION | Of increased importance |
Campaigns should aim at |
| DISTRIBUTION | Extensive |
Strengthen position in major |
| time for a new strategy !!! | ||
Declining |
Market |
Strategy |
|---|---|---|
| PRODUCT | Declining sales and profits; fewer competitors |
Consolidate product line; determine exit point. |
| PRICE | Price war as brands exit the market |
Selective pricing |
| ADVERTISING | Limited |
Reminding ads, harvest brand preference. |
| PROMOTION | Intensive promotion |
Aim at reducing inventories. |
| DISTRIBUTION | Consolidated |
Concentrate on efficient channels. |
STRATEGY OPTIONS: MARKET SHARE
STRATEGY I: MAXIMUM SALES GROWTH |
|---|
We will target the markets with the highest growth potential, i.e., markets in the introductory and growth phases and where there is not much competitive action. |
|
STRATEGY II: MAXIMUM PROFIT GROWTH |
We will target those markets where we have a strong position and low competitive activity thus providing higher profit potential. |
|
STRATEGY III: OPTIMUM GROWTH |
| We will target those markets which guarantee the highest sales and profits during the life of the product. |
| STRATEGY I: | INCREASE MARKET SHARE |
|---|---|
| IF THE MARKET: | THEN: |
Is in the Introductory |
The market grows automatically, and we can grow with it. We must aim at increasing the awareness and acceptance levels of the product by heavy adverting and promotional activities; or by increasing the distribution coverage. |
| IF THE MARKET: | THEN: |
Is in the Mature |
It is more difficult to increase the total market.
|
| STRATEGY II: | INCREASE MARKET SHARE |
| IF THE BRAND IS: | THEN: |
Market Leader |
This strategy offers limited opportunity. One exception is the mature market where sales consolidation is taking place and small brands withdraw from the market for lack of profits. |
| STRATEGY III : | DEFEND MARKET SHARE |
| IF THE BRAND IS: | THEN: |
| A profitable #2 brand |
The best way to defend our market position is to anticipate competitive actions; improve on the brand's weaknesses, reinforce its strengths. |
| STRATEGY I: INCREASE MARKET SHARE |
|---|
|
We will build on competitive weaknesses by introducing differentiations in the marketing mix: product, advertising, distribution, price or promotion. |
| STRATEGY II: INCREASE MARKET GROWTH |
| This option is available only if we are able to create s unique mrket position for our brand by successfully differentiating in the marketing mix. Otherwise, the competition will benefit from our strategy due to their strength in the market. |
| STRATEGY III: Plan to exit the market the most profitable way. |
STRATEGY OPTIONS: FINANCIAL
| STRATEGY I | MAXIMUM PROFIT GROWTH |
|---|---|
IF THE MARKET: |
THEN: |
Is in the Mature |
We will target those markets where the brand has a strong position and there is low competitive activity - those markets allow for higher profit potential. |
| STRATEGY II | MAXIMUM SALES GROWTH |
IF THE MARKET: |
THEN: |
Is in the Introductory |
We will target the markets with the highest growth potential irrespective of profits. |
| STRATEGY III | OPTIMUM GROWTH |
IF: |
THEN: |
| No company directive |
We will target those market which guarantee the highest sales and profit levels during the life of the product. |
STRATEGY OPTIONS: PRODUCT
| ACCORDING TO MARKET CHARACTER | |
|---|---|
| IF: | THEN: |
COMMODITY MARKET
|
Create brand preference by segmenting the OTHER ELEMENTS of the marketing mix. |
| IF: | THEN: |
PRODUCT DIFFERENTIATION |
Define a SPECIAL CONSUMER SEGMENT with no competition but large enough to realize sales and profit objectives and develop a product that meets its needs. |
| ACCORDING TO COMPETITIVE FRAMEWORK | |
|---|---|
| IF: | THEN: |
If our brand is SUPERIOR to competition |
Concentrate on product INNOVATIONS and identify new consumer segments to stay ahead of competition. Improve position in the other elements of the marketing mix. Introduce private brands. |
| IF: | THEN: |
If our brand is at PARITY or INFERIOR |
Aim at SUPERIORITY or PARITY- depending on share objectives - by eliminating product weaknesses. Identify unique consumer segments and preempt them from competition. Introduce private brands. |
| ACCORDING TO CONSUMER NEEDS | |
|---|---|
| IF: | THEN: |
There is an UNFULFILLED |
Define the relevant consumer segment and its size. If its size is significant enough, introduce new product features to meet those needs. |
| IF: | THEN: |
Consumer needs are fully |
Introduce additional product features by broadening the market definition. Introduce products with more unique (or efficient) features combinations. |
| ACCORDING TO PRODUCT LINE | |
|---|---|
| IF: | THEN: |
Commodity market |
Market ONE PRODUCT. |
| IF: | THEN: |
Wide price range |
Market a PRODUCT LINE.
THEN: |
STRATEGY OPTIONS: PRICE
| ACCORDING TO MARKETING STRATEGY | |
|---|---|
| IF: | THEN: |
The marketing strategy is based on PRICE |
We want to be the LOW COST PRODUCER. |
| IF: | THEN: |
The price is a function of the |
The price levels depend on: |
| ACCORDING TO PRICE ELASTICITY | |
|---|---|
| IF: | THEN: |
The product is PRICE SENSITIVE |
We will set the LOWEST possible price in accordance with the overall marketing strategy. |
| IF: | THEN: |
The product is NOT price sensitive |
We will set the HIGHEST possible price in accordance with the overall marketing and segmentation strategies. |
| ACCORDING TO PRODUCT LIFECYCLE | |
|---|---|
| IF INTRODUCTION: | THEN: |
HIGH DEMAND |
HIGH PRICE |
| IF GROWTH: | THEN: |
|
DECREASING prices, or |
| IF MATURE: | THEN: |
PRICE CUTTING |
|
| IF DECLINING: | THEN: |
Price war |
|
| ACCORDING TO CORPORATE OBJECTIVES | |
|---|---|
| IF: | THEN: |
SHARE INCREASE |
LOWER prices |
| IF: | THEN: |
PROFIT MAXIMIZATION |
HIGHER prices |
| IF: | THEN: |
SURVIVAL |
Cover COST and part of fixed expenses |
STRATEGY OPTIONS: DISTRIBUTION
| OBJECTIVE: INCREASE MARKET REACH | |
|---|---|
| IF: | THEN: |
We are or want to be the market leader. |
Aim at being present in the |
| IF: | THEN: |
We are present in the major outlets. |
Widen distribution through outlets which reach our target segment better; or where we can have a competitive advantage. |
| OBJECTIVE: INCREASE DISTRIBUTION SHARE | |
|---|---|
| IF: | THEN: |
We are present in the major outlets. |
Increase distribution share with the major outlets. |
| IF: | THEN: |
We are strong and want to increase, market share. |
Identify channels where the brand is weak and correct the situation. |
| IF: | THEN: |
We are a profitable small brand. |
Concentrate on channels where the brand already has a strong position in order to maintain share. |
| OBJECTIVE: DEVELOP NEW CHANNELS | |
|---|---|
| IF: | THEN: |
We are market leader and want to expand the market. |
Develop new distribution channels where consumers would buy our product but it is currently not for sale. |
STRATEGY OPTIONS: ADVERTISING
| SIZE OF BUDGET DEPENDS ON: | ||
|---|---|---|
INFLUENCING FACTORS |
MAXIMUM LEVEL |
MINIMUM LEVEL |
MARKET SHARE OBJECTIVES:
|
Function of advertising goals |
Capitalize on first experiences: improve product acceptance and production efficiency. |
"PULL" PRODUCT:
|
Function of share objectives |
Function of competitive spending levels and media mix |
"PUSH" PRODUCT:
|
|
|
| NEW PRODUCT |
To create brand preference
|
|
LOW PRICE STRATEGY |
If the product category is not well known
|
|
| ADVERTISING BUDGET VS. COMPETITION |
|---|
| IF: THEN WE MAY SPEND LESS |
Our product is of superior quality. |
| IF: THEN WE MAY SPEND MORE |
We want to increase market share. |
| OBJECTIVE I | INCREASE MARKET GROWTH |
|---|---|
| IF: | THEN: |
Our brand is market leader and overall product awareness and acceptance are low |
The advertising message should sell the unique benefits of the PRODUCT CATEGORY to the target market. |
| OBJECTIVE II | MAINTAIN, INCREASE BRAND SHARE (OR HALT DECLINE) |
| IF: | THEN: |
| Our brand has a low market share |
The advertising message should sell the unique benefits of OUR PRODUCT to the target market. |
| OBJECTIVE III | CREATE, CHANGE, IMPROVE OR REINFORCE BRAND IMAGE |
| IF: | THEN: |
| There is a discrepancy between the perceived general brand image and the product image, |
The advertising message should give general brand information expressing the image as defined in the product strategy. |
NOTE: |
|
| TIMING OF CAMPAIGNS | |
|---|---|
| OPTIONS: | WHEN: |
SEASONAL ADVERTISING |
New product, leading brand, product differentiation, unique medium, substantial budget |
COUNTER SEASONAL ADVERTISING |
Limited budget, high product and brand recognition, mature market |
CONSTANT ADVERTISING |
New product, substantial budget, new brand |
| TYPES: | ADVANTAGES |
CONTINIOUS ADVERTISING |
It builds up thorough product and brand image. |
| AD PULSING (FLIGHTING) |
The audience learns the message more thoroughly; less expensive. |
| ADVERTISING GOALS WILL DETERMINE: | |
|
- Number of campaigns |
|
|
WARNING! NOT TO START ADVERTISING BEFORE: |
|
STRATEGY OPTIONS: PROMOTION
| SALESFORCE DIRECTED PROMOTIONS | |
|---|---|
| IF OBJECTIVE: | THEN: |
IMPROVE SALESFORCE |
To improve sales, or distribution, sometimes the most efficient way is to direct our promotional activities on the salesforce. |
| DISTRIBUTION DIRECTED PROMOTIONS | |
| IF OBJECTIVE: | THEN: |
| IMPROVE WEAKNESSES in distribution as defined during the strategy development process. |
Giving special support to a distributor either because we want to improve our share with the distributor or because we want to build out a new type of channel. |
| CONSUMER DIRECTED PROMOTIONS | |
|---|---|
| IF OBJECTIVE: | THEN: |
INCREASE SALES |
Direct promotional campaigns to consumers which is usually based on price reduction. |
REMOVE SALES IMPEDIMENTS |
Consumer education by explaining how to use the product; what its benefits are; how its quality compares with other brands. |
| INTRODUCE A NEW PRODUCT |
The introduction of a new product is usually supported by promotional campaigns to overcome consumer and trade resistance. |
| BUILD CONSUMER LOYALTY |
For goods were repurchase is important like packaged goods, airline tickets, grocery stores, or for service providers like banks, taxis, hotel... |
| Advertising vs. Promotion | |
|---|---|
| IF PRODUCT: | THEN EMPHASIZE: |
"PULL PRODUCT"
|
Advertising
|
LOW PRODUCT AWARENESS |
Advertising and Promotion |
| NATIONAL PROBLEM |
Advertising |
| ACCORDING TO PRODUCT LIFECYCLE IF: | THEN EMPHASIZE: |
INTRODUCTION |
Advertising |
MATURITY |
Promotion |
| IF: | THEN EMPHASIZE: |
Distribution plays an important role |
Promotion |
| IF: | THEN EMPHASIZE: | Low price is important |
Promotion |

