MARFIN makes the numbers talk!
The MARFIN marketing management system follows a logical path from market analysis to the compilation of a marketing plan. It breaks down this process according to the elements of the marketing mix. Each element of the marketing mix represents an individual section: market, market share, product, price, distribution, advertising, promotion and there is also a financial section (the 5th P).
Each section consists of a series of charts which are needed for fundamental business analysis and strategy development. Within each section, MARFIN takes the planner through the planning process step by step: first the analytical charts, then the decision-making charts.
Here is an example of the dataflow in the Market Section: Charts 1.1 to 1.6 analyze the market development, and we make the final forecast in Chart 1.7. Chart 1.9 analyzes the market trend. Strategy decisions are made in Charts 1.10 and 1.10.1.

Since MARFIN follows a logical path, each item of information (each number) it collects has a purpose, a specific role to play, and each chart has a marketing objective to achieve. That is why we call them SmartCharts.
The role a chart plays and the special knowledge it transmits depend on the chart’s place within the planning process.
Let’s see how MARFIN provides this special insight:
- The flowchart of a section as seen above defines the role of a chart in the planning process.
- The objective of each chart is identified at the top of the chart and can be accessed by clicking on the question mark (?) next to the title.
- When a chart is opened, it contains the information that was entered previously in different charts. Under each chart there is an Explanation button which explains where the numbers in the chart originally were entered, and identifies the new information that we have to enter. This information can be research data or a strategic decision we have to make, depending on the function of the chart.
- The SmartCharts aid us in interpreting the meaning of the numbers in two ways:
- First of all, by having the rows and columns of each chart designed and programmed in such a way as to display all the available information we need to make the required decision at that particular stage of the planning process. What decisions we need to make are described in Marketing Tasks, the access button for which can be found under each chart.
- Secondly, by taking advantage of the data handling capabilities of the latest technological developments. In addition to the data entry (main) charts, MARFIN includes numerous programmed subcharts and graphs. The function of these charts and graphs is to display the original information that was entered in the main chart in different ways so as to provide us with an easy understanding of the numbers and being able to draw sound conclusions concerning the market situation.
For example:
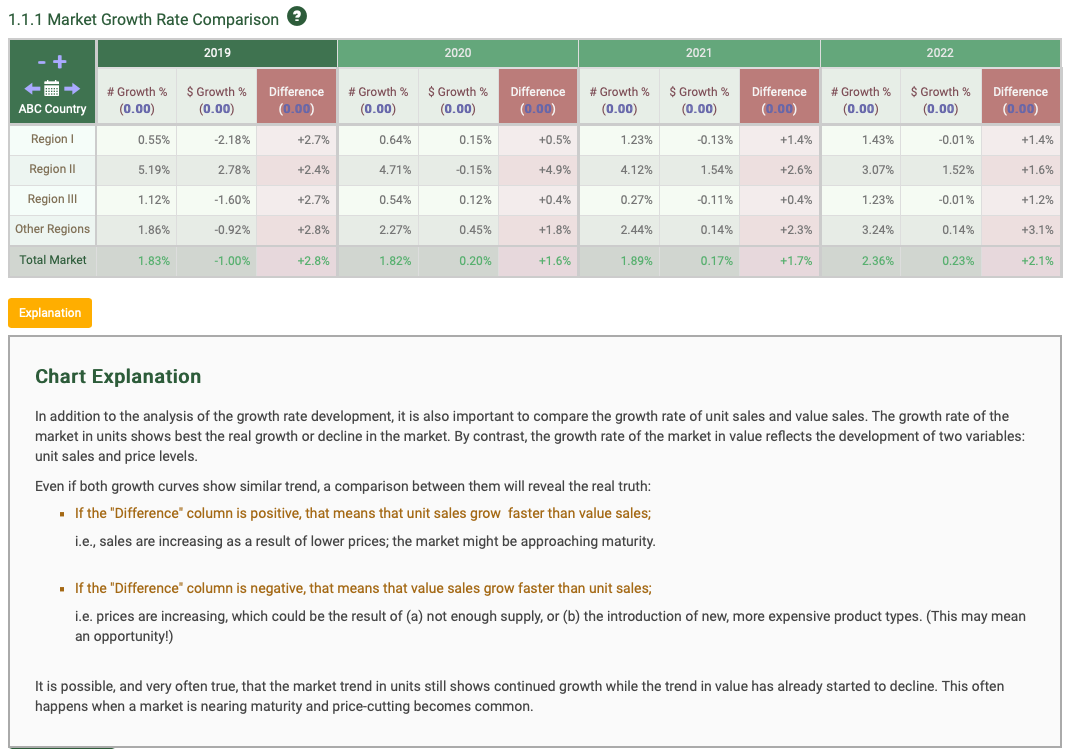
In Chart 1.1, we enter the market development numbers obtained from market research. MARFIN requests the entry of both unit sales and sales in value.
The advantage of having a digital platform is that as the numbers are entered, the program automatically calculates the growth rates. MARFIN further takes advantage of the power of a digital database by rearranging the numbers in subcharts in several programmed creative ways. Subchart 1.1.1, compares the growth rates in unit sales and in dollar sales. This comparison provides insight into an additional dimension, the price. Under the chart, there is even an Explanation key.
This is how each chart will talk to you. Revealing new insights and open your world of creativity. Check out our demo plans at www.emarfin.com